
Palo Alto number two in the nation behind Davis at 10.1%
The U.S. Census released their 2011 American Community Survey estimates on Wednesday, and San Francisco Peninsula bike advocate Andrew Boone found some surprising gains for the region.
Visit the US Census FactFinder web page. For “topic or table name”, enter “S0801” (without the quotes). For “state county or place” enter the name of your city or county. For a city name, you’ll see a drop down selection that includes “City Name city.” Select that, then press “GO.”
If your city has a population greater than 65,000, you’ll find the brand new 2011 data as one of your choices listed as “2011 ACS 1-year estimates.” Click that table, and you’ll see data for “COMMUTING CHARACTERISTICS BY SEX.” The humble bicycle is one of the listed items beneath “MEANS OF TRANSPORTATION TO WORK.”
The current refresh from the U.S. government shows estimates for communities with a population over 65,000. Beside the obvious larger cities in the San Francisco Bay Area, this includes smaller cities such as Palo Alto, Mountain View, Sunnyvale, Santa Clara, Daly City, and San Mateo.
Andrew Boone crunched for several cities on the Peninsula, the South Bay and the East Bay and discovered big gains for a few cities.
- Mountain View is now (in 2011) at 6.2%, up from 4.1 in 2010.
- Berkeley is now (in 2011) at 8.8%, up from 8.0% in 2010.
- Palo Alto is now (in 2011) at 10.1%, up from 8.6% in 2010.
- Menlo Park is at 8.8% for the period 2008 – 2010 (no new data, fewer than 65,000 people).
- For the Stanford University “Census Designated Place” (CDP), the bicycle mode share is an astounding 40%.
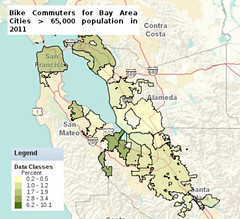
This map shows San Francisco, Peninsula, South Bay and East Bay cities with updated 2011 bicycle commute estimates from the US Census. The shadings show the comparative share of bike commuters for Alameda, Berkeley, Daly City, Fremont, Hayward, Milpitas, Mountain View, Oakland, Palo Alto, Redwood City, San Francisco, San Jose, San Leandro, San Mateo, Santa Clara, and Sunnyvale. Click through for a larger image.
Those are the only Bay Area cities with a bike-to-work mode share of over 5%. Palo Alto is the first Bay Area city ever to break 10%. Palo Alto has passed Boulder, Colorado (9.6% bike to work) to become the #2 bike city in the entire country, and is creeping up on #1 Davis, whose bike-to-work mode share is now at 16.6% and dropping. (The UC-Davis CDP matches Stanford’s 40% mode share).
The same percentage of commuters now use bikes to get to work in Mountain View (6.2%) as in famed Portland, Oregon (6.3%). The city of Mountain View, California managed to triple the bike mode share since 2000, matching the gains made by Portland, OR in the same time period. Mountain View is home to several notable high technology entities, including Google, Intuit, Symantec, Mozilla, and LinkedIn. The NASA Ames Research Center at Moffett Field adjoins Mountain View near Google’s headquarters.
Although I see substantially more bike commuters through downtown San Jose over previous years, San Jose as a whole did not register an increase in bike commuters. Redwood City, Sunnyvale, Santa Clara and San Jose remain below 2%. San Francisco remains steady at 3.4%.
Remember, the US Census only counts one mode of transportation for each worker. Although I consider myself a bike commuter, I usually ride more miles on a bus than I do on the bike, so the US Census considers me a user of public transportation.
Thank you to Andrew Boone for researching this topic and making the data availablem, who told me to “steal it!” regarding his data. You can read more from him at Peninsula Transportation Alternatives. Tip of the hat to Ladyfleur.
How are these percentages determined? 1 out of 10 trips to work in Palo Alto is by bicycle?! I don’t believe that. I work in Palo Alto, and I find it quite a stretch of the imagination to think that, during rush hour, for every 10 workers driving, taking the bus, or walking to work there is 1 bicyclist. I ride all over Palo Alto, and I feel like I am in a minority that is an order of magnitude smaller than 10%.
I’m guessing what it means is that, over the course of say a month, 1 out of 10 people will ride to work (and only during the non-rainy season). That seems more likely. But many people only ride once in a while, so I think this statistic is a little misleading if this is the case. I mean, at *any* *given* *moment, what is the percentage of commuting trips that are by bicycle? I bet that number is a lot lower.
The survey questionaire asks something like “How did you get to work the last time you went to work?”
Remember, these are residents of Palo Alto, not workers. Everybody you see driving to work in Palo Alto likely live somewhere else (that’s why they drive, right?) Out of 30,000 workers who live in Palo Alto, about 3,000 of them biked to work. Margin of error for Palo Alto is ±2.8%
The question in the survey is worded “How did this person usually get to work LAST WEEK? If the person used more than one method of transportation during the trip, select the one for most of the distance.” http://www.census.gov/acs/www/Downloads/QbyQfact/PJ_work.pdf
Good point about it being residents versus people commuting in from outside PA. Guess that makes (more) sense then. I have to admit, it’s a little misleading though. I mean, as a city government, if your own residents are riding their bikes at 10% but your infrastructure and policy keeps encouraging those from outside the community to drive to your city (and those people are driving from cities where the cycling rate is much smaller), you’re kinda contradicting yourself. At the end of the day, as a cyclist in Palo Alto (whether you live there or not), what you really care about is how many people are bicycling on the city’s roads versus driving, and that number is much, much smaller than 10%.
But I believe the point of your article was that the numbers of cyclists in PA is increasing, and that still holds. So that’s good.
By the way, another reason this is misleading is comparing to Davis. This is because the traffic patterns are very different. As you pointed out, in PA much of the traffic is from people outside the city commuting in. But this is not the case when Davis, so the effect is that the percentage of cyclists on the road at any given time is much higher than PA.
Richard, this is great stuff. Do you think the increase in bike commuters is due more to the economy or the green movement? Either way, great to see a climb in bikers in the SF area. If you’re interested, you may want to check out this graphic that shows bike commuter rates in the state of California
http://www.myassettag.com/state-cycling-statistics#CA. Only 25% of bike commuters are female/
Good job, Palo Alto people. Also good to see their neighbors in Menlo Park and Mountain View doing well, too. A lot of commuters in these neighboring towns use the same bicycle routes to get to work.
There are surely numerous reasons for the increases. One reason is new growth in the tech industry over the past few years. Facebook was located in Palo Alto during this survey period, their employees were mostly young, and the company encouraged people to live near work. The city governments help a lot by building safer bicycle routes connecting residential and business areas.
Facebook is the first thing I thought of too. Anybody who went by their California Avenue location in 2011 would see literally thousands of bikes piled around, and I suspect a good number of those employees lived either in Palo Alto or Mountain View. I’d betcha those Facebook employees accounted for the lion’s share of that dramatic increase in those two cities.
I’ve been through their new Menlo Park location too since they’ve moved in, and I don’t see nearly the number of bikes I saw on Cal Ave. I predict dramatic drops in bike commuters for Mtn View and Palo Alto for 2012 for that reason.