All bike share programs run by Alta Bike Share make their station data publicly available. For Bay Area Bike Share, you can find the real time data here. My GIS guru friend Steven Vance tells me the data is updated once every minute, and points to helpful resources like this Chicago hack night document pointing to similar APIs for Divvy, Capital Bikeshare and Hubway.
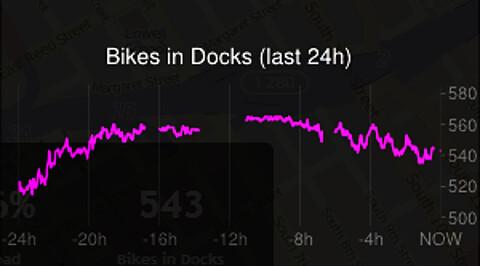
Looking at Bay Area Bike Share’s JSON datafeed it’s not too difficult to see that’s it’s an array of stations. Each element has station name and location data, the number of bikes available at that station, and the number of open slots for bike return. Oliver O’Brien used the data to include Bay Area Bike share on his real time international bike map shortly after the service began on August 29. With O’Brien’s map, you can even see usage history systemwide over the past 24 hours. He also has fancy animations showing station usage that are pretty to look at, especially on a global scale.
I’d like to know, however, how usage compares across the different cities in the Bay Area. For that, a tiny bit of extrapolation is needed, and I can use some reader help to ensure the accuracy of my information. The 700 bikes of Bay Area Bike Share are supposed to be distributed among the five participating cities. Press material from the involved agencies says we have 350 bikes in San Francisco, 130 bikes in San Jose, and 50 bikes in each of Mountain View, Palo Alto, and Redwood City.
This only adds up to 630 bikes. Does anybody know where the missing bikes are at? You might see the O’Brien graph shows the maximum number of available bike at 570 or so.
I use those numbers to calculate the number of bike in use, so the displayed data is only as good as my assumptions. If you know my data on total bikes is wrong, please let me know in the comments. During the day today, usage in San Jose has ranged from a dozen to 20 bikes in use, San Francisco has ranged from 60 to 80, Palo Alto and Mountain View has moderate use with a half dozen bikes in use at any given time.
Redwood City is an anomaly, with 51 bikes recorded as ‘available’ for most of the day. My guess: somebody brought a Bike Share bike onto Caltrain from elsewhere and parked it in Redwood City, so RWC now has an extra bike. When nobody’s riding (which seems to be most of the time), we see minus one bikes in use on the Peninsula.
The data from the bike share stations is updated once every minute. I should probably store this data over time, graph it and see what happens. Let me know if you think something like this could be useful.
Oh, I almost forgot: click here to view the real time bike usage by city for Bay Area Bike Share.