
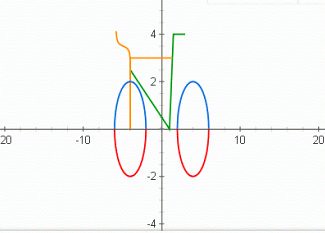
Here are a set of four mathematical functions that, when graphed, create a picture of a bicycle. With an update giving a new, improved visualization that includes the seatstays.
√(4-(|x|-4)^2)

-√(4-(|x|-4)^2)

(0.5-0.5 × |x+4|/(x+4)) × √(|x+5.8|/(x+5.8)) × (tan(-(x+4.9) × π/2)+35)/10+3 × (0.5+0.5 × |x+3.99|/(x+3.99)) × √(-|x-1.375|/(x-1.375))

-(x-1)/2 ×  √(|x+4|/(x+4)) ×  (0.5 - 0.5 ×  |x-1|/(x-1)) + 8 × (x-1) × (0.5 - 0.5 ×  |x-1.5|/(x-1.5)) × (0.5 + 0.5 ×  |x-1|/(x-1))+ 4 ×  (0.5 + 0.5 ×  |x-1.5|/(x-1.5)) × √(-|x-3|/(x-3))
Plug those functions into Google’s new graphing tool, and you get a picture of a bicycle!
Google announced on Monday this new graphing functionality on their search engine. Type in up to four functions (separated by commas) and Google will display a graph of those functions.
I tried to come up with a set of functions to draw a bicycle, but the four function limit and an apparently inability to restrict the results limited me to just drawing a pair of wheels. I was experimenting with absolute values and adding functions together to draw the rest of the frame, but Alex Fabrikant beat me to it and created this wonderful bicycle graph.
Here’s the graph on Google (punch the zoom-out button to see the whole thing) if you’d like to play with this yourself by adding, say, a chainstay and / or seat stay. Because there’s only a single “y” value to go with each X, each of the stays will require its own function.
Update: New, improved version by Alex here includes a seatstay!
Love this! 😀