To provide the best experiences, we use technologies like cookies to store and/or access device information. Consenting to these technologies will allow us to process data such as browsing behavior or unique IDs on this site. Not consenting or withdrawing consent, may adversely affect certain features and functions.
The technical storage or access is strictly necessary for the legitimate purpose of enabling the use of a specific service explicitly requested by the subscriber or user, or for the sole purpose of carrying out the transmission of a communication over an electronic communications network.
The technical storage or access is necessary for the legitimate purpose of storing preferences that are not requested by the subscriber or user.
The technical storage or access that is used exclusively for statistical purposes.
The technical storage or access that is used exclusively for anonymous statistical purposes. Without a subpoena, voluntary compliance on the part of your Internet Service Provider, or additional records from a third party, information stored or retrieved for this purpose alone cannot usually be used to identify you.
The technical storage or access is required to create user profiles to send advertising, or to track the user on a website or across several websites for similar marketing purposes.
I recently got to participate in a transportation survey. On the day they chose for me to do my survey, I walked to work instead of biking. Oh well. That’s good too, right? Cyclists and pedestrians both, represent!
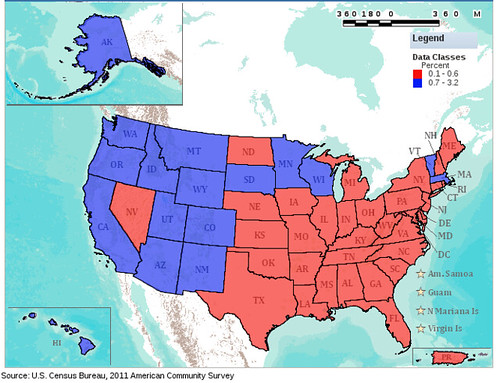
Only VT & MA east of the Mississippi? Passing strange…
The fact that 0.6% is the average is pathetic. That’s like 1 person in 200.
So, what’s your theory about why SD is above average while ND and NE are below average?
“average” isn’t the best measure of central tendency to use here – huge range, w outliers at the top (like Oregon and its 6.x%), and a zero limit at the bottom. Above/below median would be more appropriate.
Does ACS Fact Finder have median values for their map tool?
You’re the 2nd person to notice this interesting South Dakota discrepancy. I guess I’ll dig into it a little.. and I find:
North Dakota: 0.6%
South Dakota: 0.7%
Nebraska: 0.5%
So a tenth of a percentage point separates North from South in this instance.
you should switch colors lest someone think that biking is political
First thing that popped into my head was that the western states have really hopped on to biking. The midwestern and southern states are slow to follow. Could be a weather issue, but that doesn’t explain everything since Alaska and states in the Great Lakes area also have an above average cycling rate. I love analyzing data and trying to explain correlations. Thanks for sharing!
You should have lied.
Another factor you could put into the mix. How healthy are these places. Minnesota continually ranks in high health studies. Bicycle commutes are not just about getting somewhere, but your well being.
Planning my cardio exercises, is nothing more than a destination.
I wonder how many people skew their results because of green guilt?
I initially did this specifically to compare this vs support of Romney vs Obama in polls. There doesn’t seem to be much correlation.
Is it possible to break this down by metro area rather than state? It would also be useful to have three categories – perhaps 0-0.5%, 0.51-1.0%, 1.01+%. My guess is that every city is in the middle or top category, and most suburbs are in the bottom one. Most of the eastern states don’t appear here because the suburbs outweigh the cities.
Also, does the ACS gather data at a particular time of year, or all year? If it’s in the winter, then that could also explain why western states are represented but eastern states aren’t – winters generally aren’t as harsh in the west.
Hi Kenny, yes you can split things up any way you want. I discuss the data a little bit here in this earlier post.
RIght now there’s only data for communities with population over 65,000. Steve Vance (of Grid Chicago) tells me more data will be available in December. For smaller populations, the data becomes less reliable so they’re collated into 3 year or 5 year summaries, depending on the population size.
Surveys are collected every month, and I believe the surveys are distributed geographically (e.g. Census doesn’t focus on California in the July and Massachusetts in January).